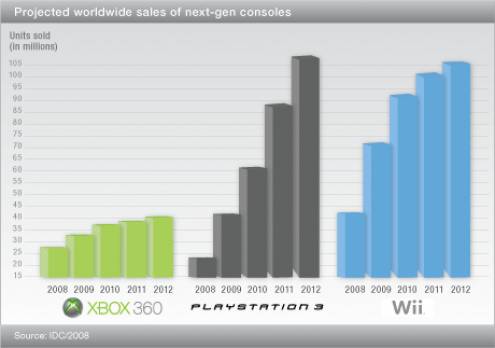
 First, check out the above graph from this article at CNET.
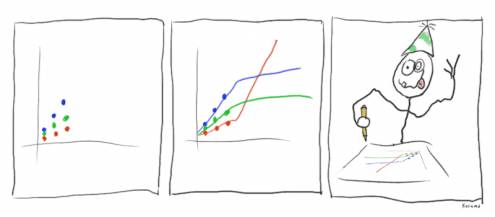
Then check out the following graph found in the NeoGAF forums.

Which one makes the most sense to you?
[Thanks, ejamer!]
 First, check out the above graph from this article at CNET.
Then check out the following graph found in the NeoGAF forums.

Which one makes the most sense to you?
[Thanks, ejamer!]